Introduction
For winemakers, it is very important to know how to judge the quality of wine by its chemical components. In this report, we analyze the white wine dataset, use random forest algorithm and logistic regression algorithm to build models to distinguish the quality of wine, and determine the importance of each chemical component for wine quality judgment by its weights in both algorithm.
Exploratory Data Analysis
First import the dataset and observe the value and range of each column feature of the data set. The white wine dataset contains a total of 11 metrics of chemical composition and a column indicating the quality of the wine. All indicators are stored in the dataset in numeric form and have different ranges of values.
Analyze Target Value
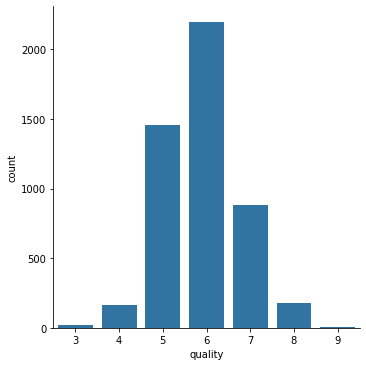
We then analyzed the distribution of wine quality. The histogram below shows that wines of average quality (scores between 5 and 7) make up the majority of the data set, while wines of very poor quality (scores less than 4) and excellent quality (scores greater than 8) are less common. For quantitative discussions, we define wines with scores of 6 or more as high quality and wines with scores less than 6 as low quality.
Analyze Features
Next, we perform an exploratory analysis of the metrics in the dataset. First, we check whether the metrics contain missing values.
fixed acidity False
volatile acidity False
citric acid False
residual sugar False
chlorides False
free sulfur dioxide False
total sulfur dioxide False
density False
pH False
sulphates False
alcohol False
quality False
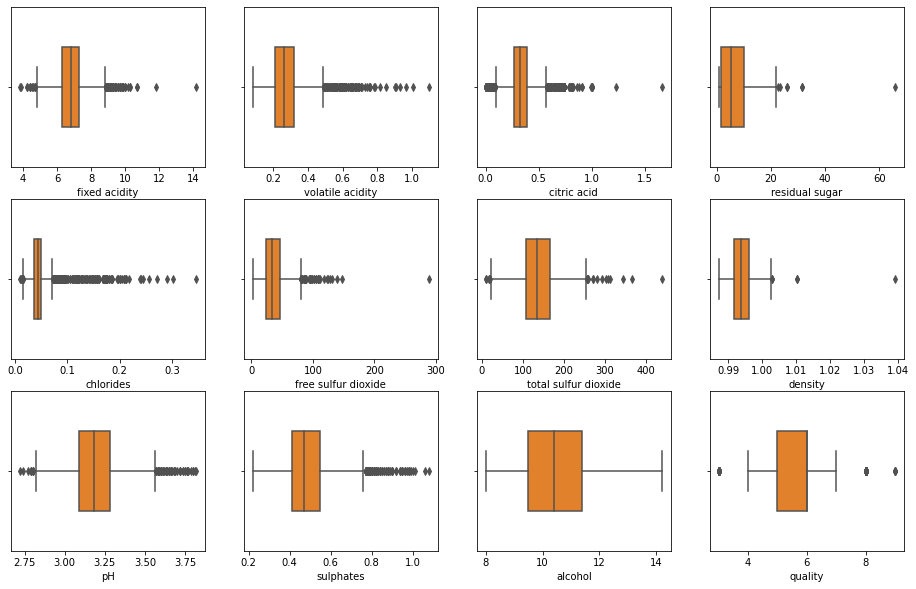
dtype: boolSince there is no missing value in the dataset, we use box plot to observe the general distribution of each metrics. As can be seen from the box plot below, the distribution of alcohol content in each wine is relatively concentrated, but there are great differences in metrics such as chlorides and volatile acid. Because there are many outliers in these metrics, the accuracy of logistic regression algorithm may be relatively low.
Correlation Analysis
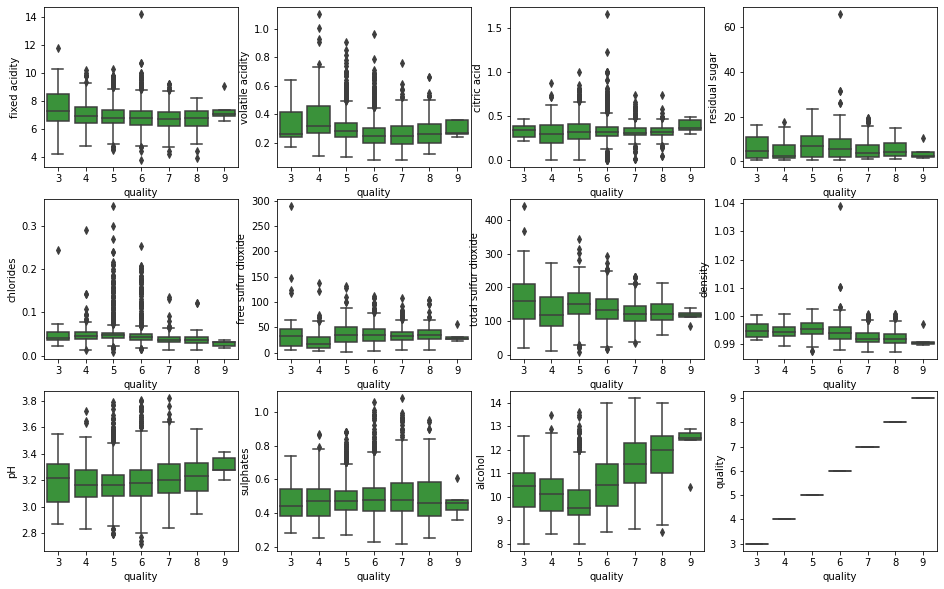
According to the data distribution of each metric in different quality white wine, the metric with obvious differentiation can be roughly identified. As can be seen from the box plot below, the difference of alcohol content is the most obvious among different quality white wines, and high quality wines usually contain more alcohol. Also, the overall pH tends to rise as the quality of the wine improves. However, there are many outliers in the pH metric, so it is difficult to be used as the basis for judging the quality of wine.
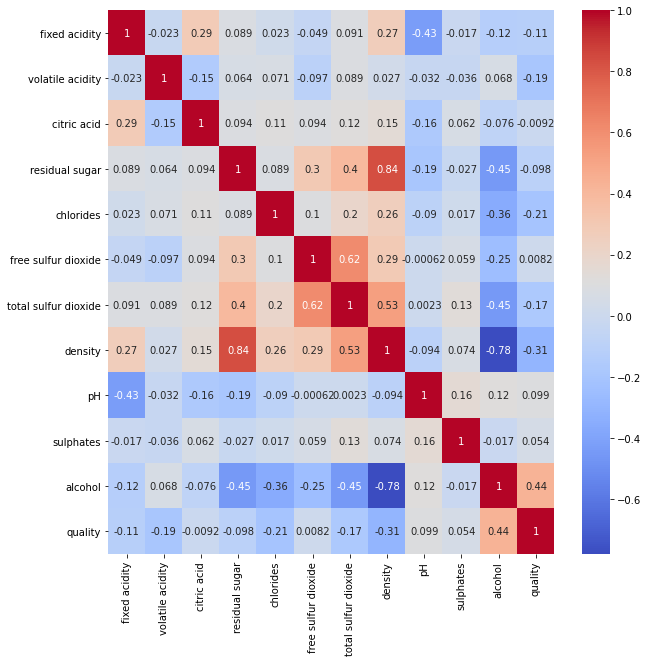
We can use Pearson correlation coefficients for a more detailed analysis of the linear relationship between the individual metrics. The heat map below shows the values of the Pearson correlation coefficients between the metrics. It can be seen that density has a strong correlation with residual sugar, alcohol content and total sulfur dioxide. This makes sense, since the density of white wines is originally determined by the type and content of chemicals in the wine. The last column shows the Pearson correlation coefficients between white wine quality and all the metrics. It shows that there may exist linear relationship between white wine quality and alcohol as well as density,which means these two metrics are important criteria for judging the quality of wine. It also shows that critic acid and free sulfur dioxide do not seem to have a linear correlation with wine quality.
We use the Maximum Information Coefficient(MIC) to detect whether there is a nonlinear or periodic relationship between each metric and the quality of white wine. The results show that alcohol and density have maximum MIC value, which is consistent with the conclusion made from Pearson correlation coefficient. So it is very likely that alcohol and density are the most important factors to measure the quality of wine. Besides, fixed acid and sulfate have the minimum MIC value. Because the conclusion(on the unrelated metrics) of MIC measurement is different from that of Pearson correlation coefficient, no metric is excluded in the model construction.
Maximal information coefficient
fixed acidity 0.027
volatile acidity 0.065
citric acid 0.065
residual sugar 0.077
chlorides 0.082
free sulfur dioxide 0.064
total sulfur dioxide 0.086
density 0.156
pH 0.035
sulphates 0.030
alcohol 0.147
Data Pre-processing
Before building model, we seperate the data into training set with 80% of original data and test set with 20% of the original data. In training set, we have 1312 samples of low quality wine and 2606 samples of high quality wine. In order to solve the imbalanced classification problem, we use SMOTE algorithm to oversample the minority class. After pre-processing, we have the same number of samples in both low quality wine class and high quality wine class.
number of samples in low quality wine(0) and high quality wine(1):
0    1312
1    2606
Name: 0, dtype: int64


0    2606
1    2606
Name: 0, dtype: int64
Logistic Regression
When building model using logistic regression algorithm, we use sklearn.preprocessing.StandardScaler to normalize the data, and use sklearn.model_selection.GridSearchCV to find the best parameter. After training, logistic regression algorithm achieve 0.761 in accuracy score and 0.831 in f1 score.
Best: 0.725469 using {'logisticregression__C': 10}
0.723603 with: {'logisticregression__C': 0.1}
0.724318 with: {'logisticregression__C': 1}
0.725469 with: {'logisticregression__C': 10}
Accuracy score is: 0.7612244897959184
Precision score is: 0.7824324324324324
Recall score is: 0.8880368098159509
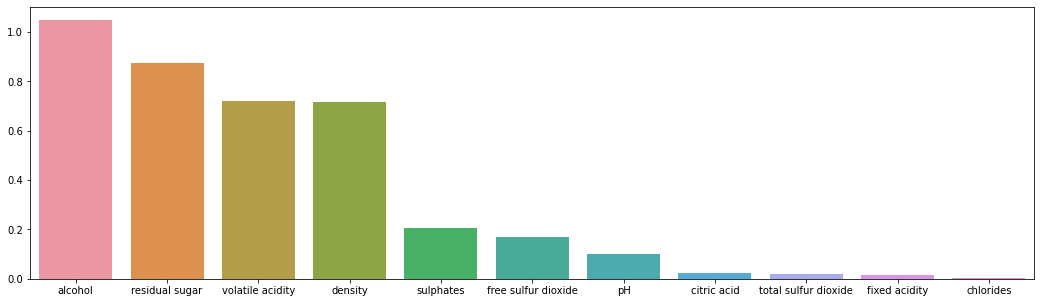
F1 score is: 0.8318965517241379We can judging the importance of different metrics by its weight in logistic regression model. According to the bar plot, alchol, residual sugar, volatile acidity and density play a more important role than other metrics in judging the quality of white wine.
Random Forest
Random forest algorithm is a better way in dealing with data with many outliers. It also prevent the overfitting problem by aggregating many decision trees to give optimal model. Since it uses decision tree as based algorithm, there is no need to normalize the data. By using sklearn.model_selection.GridSearchCV to search best parameter, we build a random forest model which achieve 0.836 in accuracy score and 0.877 in f1 score.
Best: 0.861909 using {'criterion': 'gini', 'n_estimators': 300}
0.856439 with: {'criterion': 'gini', 'n_estimators': 100}
0.859427 with: {'criterion': 'gini', 'n_estimators': 200}
0.861909 with: {'criterion': 'gini', 'n_estimators': 300}
0.859657 with: {'criterion': 'gini', 'n_estimators': 400}
0.856118 with: {'criterion': 'entropy', 'n_estimators': 100}
0.858843 with: {'criterion': 'entropy', 'n_estimators': 200}
0.857771 with: {'criterion': 'entropy', 'n_estimators': 300}
0.860638 with: {'criterion': 'entropy', 'n_estimators': 400}
[[246 82]
[ 78 574]]
0.8367346938775511
0.875
0.8803680981595092
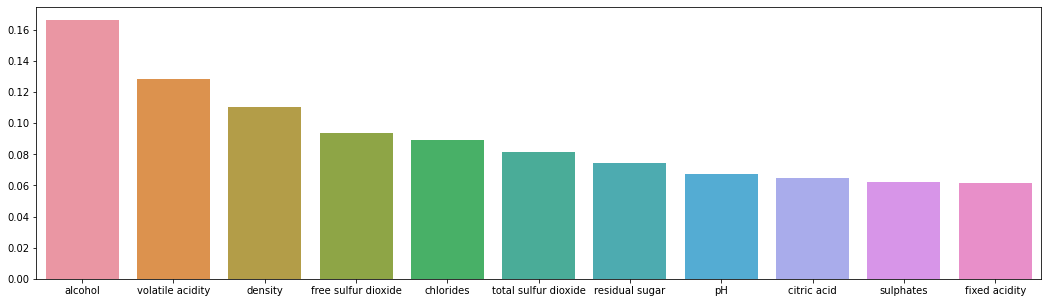
0.8776758409785932Sklearn library can estimate feature importance in decision tree-based algorithms by calculating difference of Gini index made by each node. In this model, the top4 most important metrics are alcohol, volatile acidity, density and free sulfur dioxide.
Conclusion
According to the correlation measurement made by MIC and Pearson correlation coefficient and feature importance in LR and Random forest model, alcohol is the most important metric in evaluating the quality of white wine. Generally, the higher the alcohol content, the better the quality of the wine. Some other important metrics include density, volatile acidity and residual sugar.